This section contains Italiaonline S.p.A. documentation the publication of which was mandatory up to the day of delisting of the Company’s ordinary and savings shares.
- Highlights H1 FY 2019
- Highlights FY 2018
- Revenues breakdown
- Net financial position
- Income statement
- Balance sheet
- Statement of cash flow
Highlights H1 2019
| € millions | H1 2019 | H1 2018 | YoY % Change |
|---|---|---|---|
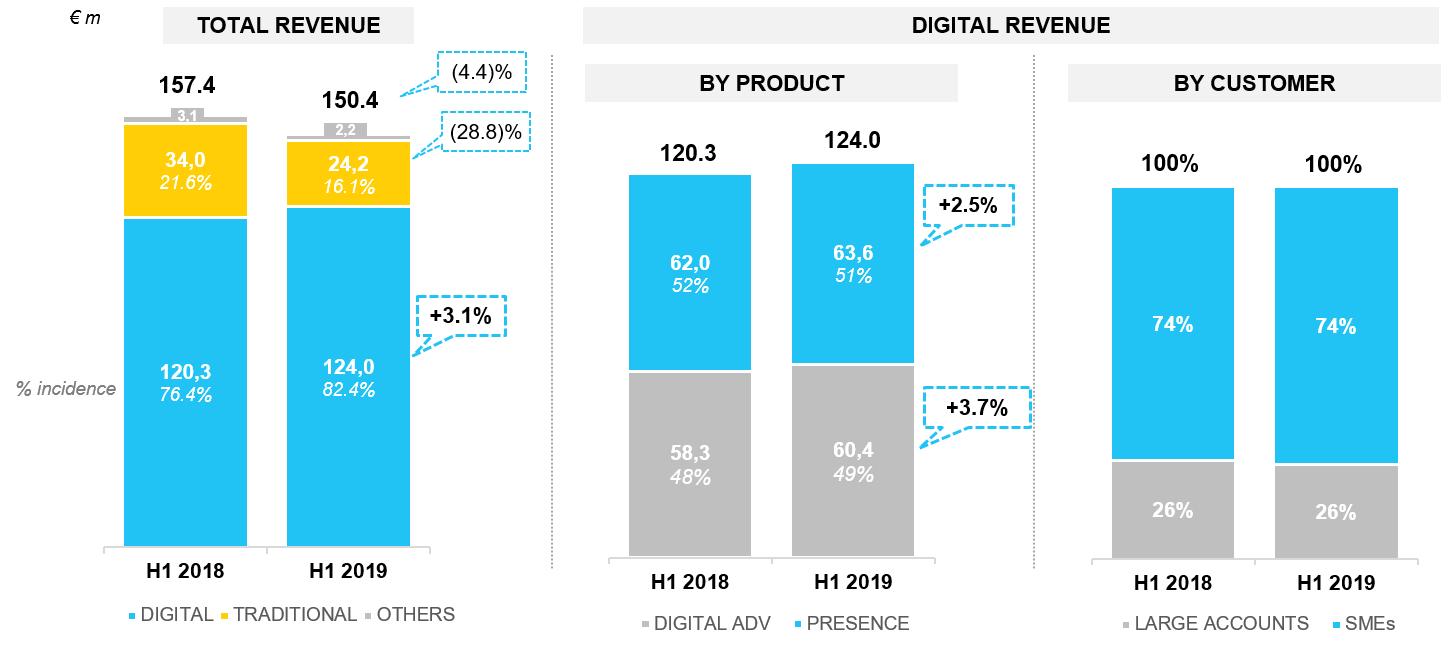
| Revenue | 150.4 | 157.4 | (4.4)% |
| of which Digital Revenues | 124.0 | 120.3 | 3.1% |
| EBITDA | 28.2 | 37.9 | (25.5)% |
| EBITDA Margin | 18.8% | 24.1% | (5.3) p.p. |
| EBITDA normalised | 26.3 | 26.4 | (0.6)% |
| EBITDA normalised margin | 17.5% | 16.8% | +0.7 p.p. |
| Net Result | 4.5 | (7.4) | n.s. |
| Net Result normalised | 4.7 | 8.7 | (46.3)% |
| Unlevered FCF | 49.0 | 24.1 | 103.2% |
| EBITDA normalised cash conversion | 186.4% | 91.2% | +95 p.p. |
| € millions | 30 June 2019 | 31 December 2018 | % Change |
| Cash holdings | 117.1 | 101.0 | 16% |
| Net Financial Position | 88.6 | 67.0 | 32% |
Highlights FY 2018
| € millions | FY 2018 | FY 2017 | Change YoY |
|---|---|---|---|
| Revenues | 324.8 | 338.5 | (4.1)% |
| of which Digital Revenues | 244.4 | 228.0 | 7.2% |
| EBITDA | 73.3 | 67.7 | 8.3% |
| EBITDA Margin | 22.6% | 20.0% | 2.6 pp |
| EBITDA normalised | 56.1 | 67.1 | (16.4)% |
| EBITDA Margin normalised | 17.3% | 19.8% | (2.5) pp |
| EBIT | (3.4) | 27.8 | n.m. |
| EBIT normalised | 12.5 | 23.3 | (46.5)% |
| EBIT Margin normalised | 3.8% | 6.9% | (3.1) pp |
| Net Result | (8.7) | 26.4 | n.m. |
| Net Result normalised | 7.1 | 21.9 | (67.4)% |
Notes:
The consolidated revenue reported in the FY2017 is €335.9 m; net of inconsistences (€2.5 m) linked to a better assessment of NWC of Consodata at 31 December 2017 following its reinstatement within the Group, the consolidated revenue for 2017 would be €338.5 m.
Normalised figures are net of non-recurring items deriving mainly from the release of provisions made in previous years (€8.5 m in 2017, €11.3 m in 2018), and net of the positive outcome of some previous litigation (€6 m in 2018); the 2017 figure includes IFRS 16 effects for €7.9 m.
H1 2019 Revenue Overview
H1 2019 | Positive NFP good cash generation
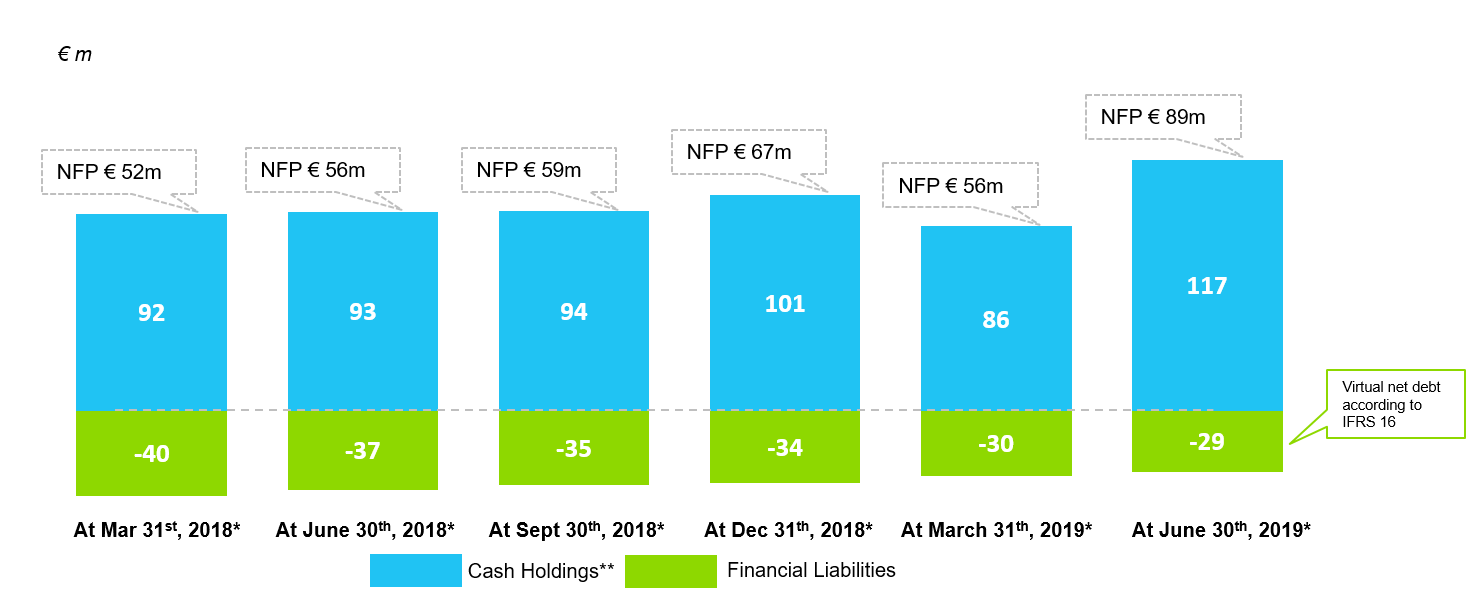
* NFP at 30 June 2019 is bank debt free. The introduction of IFRS 16, from 1st January 2018, implies the accounting of all rents NPV as asset and financial liabilities (virtual net debt at 30 June 2019 according to IFRS 16 equal to €28.6 million).
** Includes Cash and Current financial receivables from third parties.
Reclassified consolidated income statement
| (euro/million) | Year 2018 | Year 2017 | Year 2016 |
|---|---|---|---|
| Revenues from sales and services | 324.8 | 335.9 | 389.5 |
| Materials and external services | (173.0) | (180.6) | (204.5) |
| Salaries, wages and employee benefits | (70.7) | (77.4) | (99.3) |
| MOL | 81,0 | 77.9 | 85.7 |
| % on revenues | 24.9% | 23.2% | 22.0% |
| Net valuation adjustments and accruals to provisions for risks and charges | (6.6) | (10.0) | (20.3) |
| Other net operating income (expenses) | (1.1) | (0.2) | (1.5) |
| EBITDA | 73.3 | 67.7 | 63.9 |
| % on revenues | 22.6% | 20.1% | 16.4% |
| Operating amortisation, depreciation and impairment losses | (38.0) | (30.7) | (48.1) |
| Non-operating amortisation, depreciation and impairment losses | (5.6) | (5.2) | (6.0) |
| Net non-recurring and restructuring expense | (33.1) | (4.0) | (9.1) |
| EBIT | (3.4) | 27.8 | 0.7 |
| % on revenues | (1.1%) | 8.3% | 0.2% |
| Interest expense, net | 1.9 | 0.6 | 0.1 |
| Impairment losses recognised on financial assets and losses from subsidiaries disposal | 1.2 | - | (1.5) |
| Profit (Loss) before income taxes | (0.3) | 28.4 | (0.7) |
| Income taxes | (8.5) | (2.0) | 23.4 |
| Profit (loss) for the period | (8.7) | 26.4 | 22.7 |
| of which pertaining to the Group | (8.7) | 26.4 | 22.7 |
| of which non-controlling interests | - | - | - |
Reclassified consolidated statement of financial position
| (euro/million) | At 31.12.2018 | At 31.12.2017 | At 31.12.2016 |
|---|---|---|---|
| Goodwill and marketing related intangibles assets | 267.5 | 272.5 | 277.7 |
| Other non-current assets * | 92.9 | 73.4 | 77.6 |
| Non-current liabilities | (52.3) | (50.5) | (59.8) |
| Working capital | (62.6) | (52.8) | (48.2) |
| Non-current assets held for sale and discontinued operations | - | - | (2.1) |
| Net invested capital | 245.5 | 242.6 | 245.2 |
| Equity attributable to the owners of the parent | 312.5 | 315.5 | 367.3 |
| Equity attributable to non-controlling interests | - | - | - |
| Total equity (A) | 312.5 | 315.5 | 367.3 |
| Net financial debt (B) | (67.0) | (72.9) | (122.1) |
| Total (A+B) | 245.5 | 242.6 | 245.2 |
* This item includes non-current financial assets.
Consolidated cash statement of cash flows
| (euro/million) | Year 2018 | Year 2017 | Year 2016 |
|---|---|---|---|
| EBITDA | 73.3 | 67.7 | 63.9 |
| Net interest income (expense) from discounting of operating assets/liabilities and stock options | (0.3) | 0.7 | (0.7) |
| Decrease (increase) in operating working capital * | (2.3) | 11.7 | 15.4 |
| (Decrease) increase in operating non-current liabilities ** | (5.8) | (2.6) | 0.1 |
| Capital expenditure | (21.1) | (26.3) | (23.2) |
| Operating free cash flow - OFCF | 43.8 | 51.2 | 55.6 |
| Income taxes | (0.0) | (0.8) | (1.1) |
| Unlevered free cash flow | 43.8 | 50.4 | 54.5 |
| Collection of interest and financial expense, net | 0.3 | 0.4 | 1.9 |
| Payment of non-recurring and restructuring expense | (13.5) | (20.6) | (17.2) |
| Dividend distribution | (0.2) | (80.0) | - |
| Disposal of investments in Telegate AG | 3.4 | - | - |
| Share buy back | (0.1) | - | - |
| IFRS 16 effect | (41.7) | - | - |
| Other charges | 2.0 | 0.7 | 8.5 |
| Change in net financial debt | (6.0) | (49.2) | 47.6 |
* The change mainly don’t include the non – monetary effects arising from IFRS 15 adoption.
** The change mainly don’t include the non – monetary effects arising from profit and losses recognised to equity.